
 View on Asset Store (opens in new tab)
Package details
- Latest version
- 2.5
- Last updated
- First released
- Unity version
- 2019.1.0 or later
- Package size
- 384 KB
- Files
- 11
- Favorites
- 51
- Views in the past week
- 2
Price tracking
- Last checked
- Tracked since
- Lowest recorded
- $3.00 on
InGame Graphs
Price $4.99
Buy on Asset Store (opens in new tab)
Affiliate link · Purchases support this site
Price history
Last 6 months
USDAsset preview
1 / 1

InGame Graphs video 1
About this asset
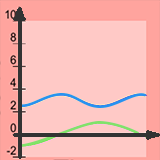
With this asset you can visualize a certain variable on a graph during play mode.
This is meant for monitoring a variable, for instance how the transform.position.x behaves with time.
This is NOT meant to plot functions
Recent Changes:
• Auto Range feature added;
• Now changes to the graphic (axis, colors, graphic limits, etc) can be seen during edit mode;
To get started all you have to do is add a graphic to the scene, and call the AddPoint() function inside the FixedUpdate().
There are several things you can control on each graphic:
• lines: how many lines can be visualized in total;
• Y Limits: bottom and top limits of the graphic;
• Interval: how much time is displayed in the graphic;
• Tick Marks Step: the step on which you see marking on the y axis
• Axis X: Is the X Axis visible;
• Axis Y: Is the Y Axis visible;
• LabelsScale: X & Y labels scale;
• Label X: what is displayed in the X axis;
• Label Y: what is displayed in the Y axis;
• Color: the colors for each line;
Having doubts about getting this asset?
Send an email to [email protected] and I'll answer any question you have.
This is meant for monitoring a variable, for instance how the transform.position.x behaves with time.
This is NOT meant to plot functions
Recent Changes:
• Auto Range feature added;
• Now changes to the graphic (axis, colors, graphic limits, etc) can be seen during edit mode;
To get started all you have to do is add a graphic to the scene, and call the AddPoint() function inside the FixedUpdate().
There are several things you can control on each graphic:
• lines: how many lines can be visualized in total;
• Y Limits: bottom and top limits of the graphic;
• Interval: how much time is displayed in the graphic;
• Tick Marks Step: the step on which you see marking on the y axis
• Axis X: Is the X Axis visible;
• Axis Y: Is the Y Axis visible;
• LabelsScale: X & Y labels scale;
• Label X: what is displayed in the X axis;
• Label Y: what is displayed in the Y axis;
• Color: the colors for each line;
Having doubts about getting this asset?
Send an email to [email protected] and I'll answer any question you have.
From the publisher's Asset Store listing.