
 View on Asset Store (opens in new tab)
Package details
- Latest version
- 1.0.1
- Last updated
- First released
- Unity version
- 6000.3.19 or later
- Package size
- 41 KB
- Files
- 12
- Views in the past week
- 9
Price tracking
- Last checked
- Tracked since
- Lowest recorded
- $12.00 on
Keywords
Ninja Profiler Pro: FPS, Memory & Debug Console
On-screen runtime profiler for Unity: FPS, frame time, memory, GC, and draw calls, plus a debug console with log capture and custom commands. Works in builds and the editor. Zero per-frame GC.
Affiliate link · Purchases support this site
Price history
Last 6 months
USDAsset preview
1 / 2
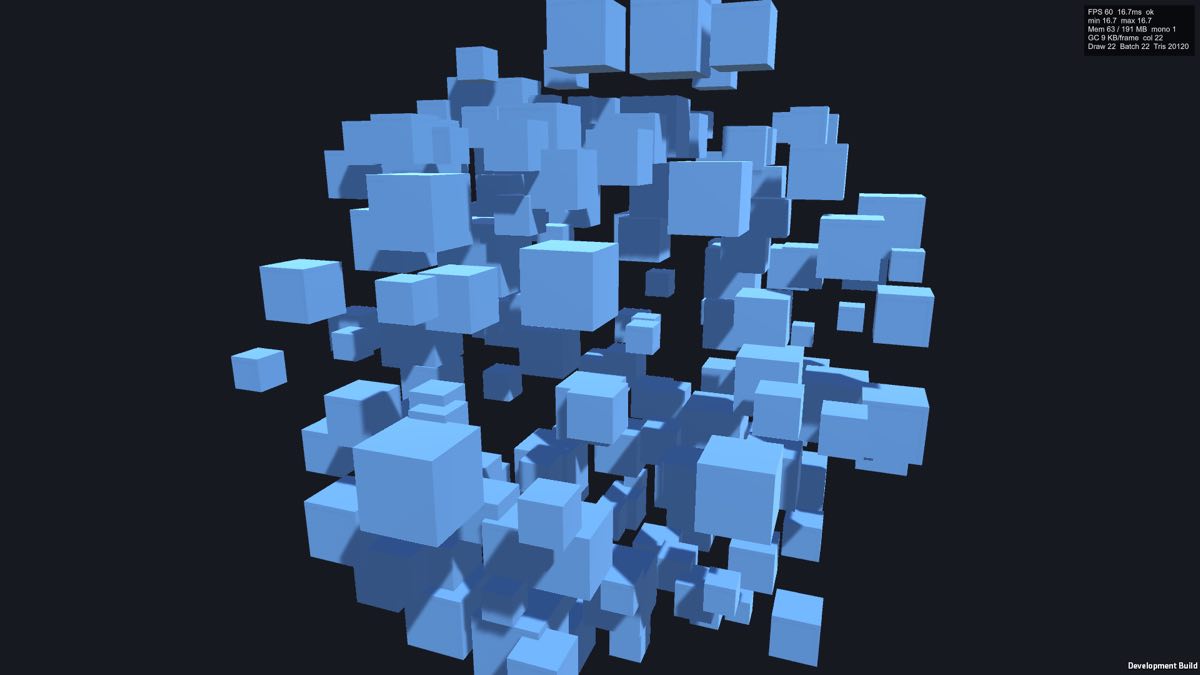
Ninja Profiler Pro: FPS, Memory & Debug Console screenshot 1
About this asset
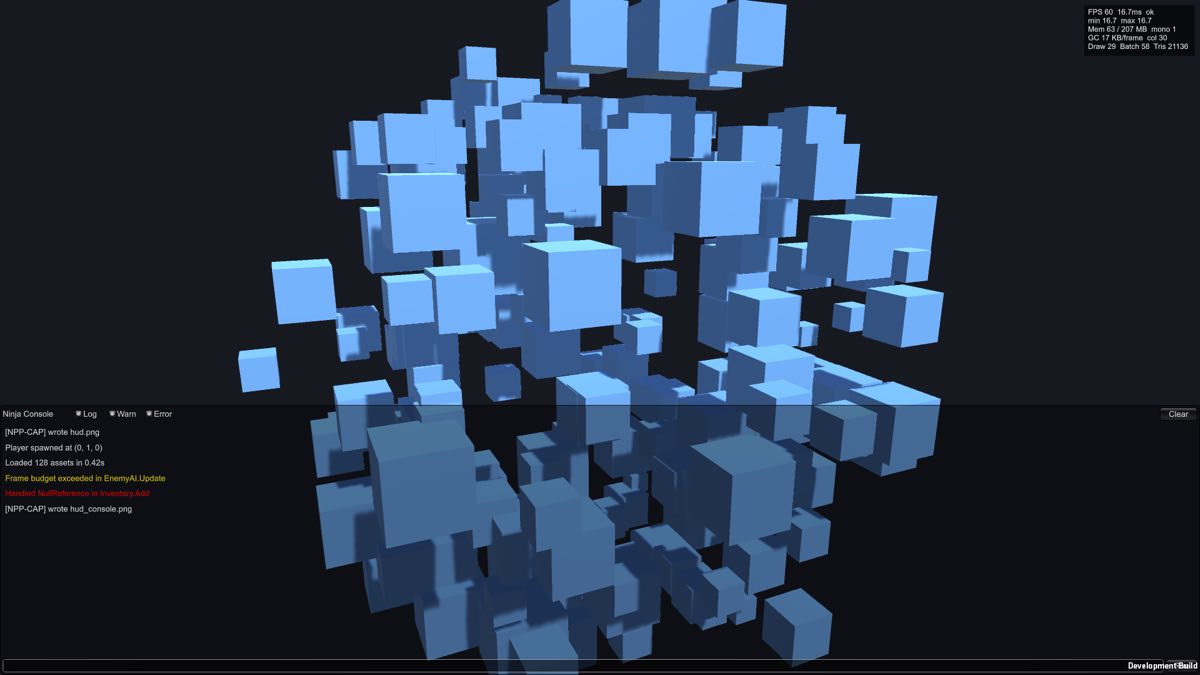
Ninja Profiler Pro puts the numbers that matter on screen, in your actual build. A compact, corner-docked HUD shows framerate and frame time (with min / avg / max), memory (allocated / reserved / mono heap), GC allocations per frame, and draw calls / batches / triangles, plus a runtime debug console that captures your logs and runs commands you bind. Drop one prefab in your first scene and press a key.
STATS HUD
- FPS and frame time (ms), rolling min / avg / max
- Memory: total allocated, reserved, and mono heap
- GC: bytes allocated per frame and collection count
- Rendering: draw calls, batches, triangles
- 4-corner dockable, scalable, hotkey toggle, target-framerate indicator, per-panel toggles
RUNTIME DEBUG CONSOLE
- Captures Debug.Log / Warning / Error with stack traces; filter by level; clear
- A command registry, bind your own: NinjaConsole.Register("give", args => ...)
- Ships with clear, fps, and gc.collect built in
BUILT TO STAY OUT OF THE WAY
The sampler allocates zero garbage per frame, so the profiler does not distort what it measures. Namespaced and asmdef-isolated, so nothing leaks into your assemblies. One drag-and-drop prefab, no setup.
WORKS IN BUILDS AND THE EDITOR
FPS and frame time are always live. Memory, GC, and draw-call counters come from Unity's profiler and populate in the editor and Development builds (Unity strips those counters from non-development release builds, where the HUD shows "n/a (dev build)" by design).
Supported: Unity 6.0 LTS and up.
The paid upgrade to the free Ninja Profiler frame-time overlay by OccaSoftware.
From the publisher's Asset Store listing.
Compatibility
| Unity version | Built-in | URP | HDRP | Custom |
|---|---|---|---|---|
| 6000.3.19f1 | Compatible | Compatible | Compatible | Compatible |
As listed on the Asset Store.