
 View on Asset Store (opens in new tab)
Package details
- Latest version
- v1.2.0
- Last updated
- First released
- Unity version
- 6000.3.14 or later
- Package size
- 115 KB
- Files
- 14
- Favorites
- 8
- Views in the past week
- 10
Price tracking
- Last checked
- Tracked since
- Lowest recorded
- $7.50 on
Keywords

Scene Performance Analyzer
- Price drop
A real-time performance heatmap tool that helps you visualize and optimize rendering costs in scenes. Perfect for targeting high-performance environments, large open worlds, or VR projects.
Affiliate link · Purchases support this site
Price history
Last 6 months
USDAsset preview
1 / 4

Scene Performance Analyzer screenshot 1


About this asset
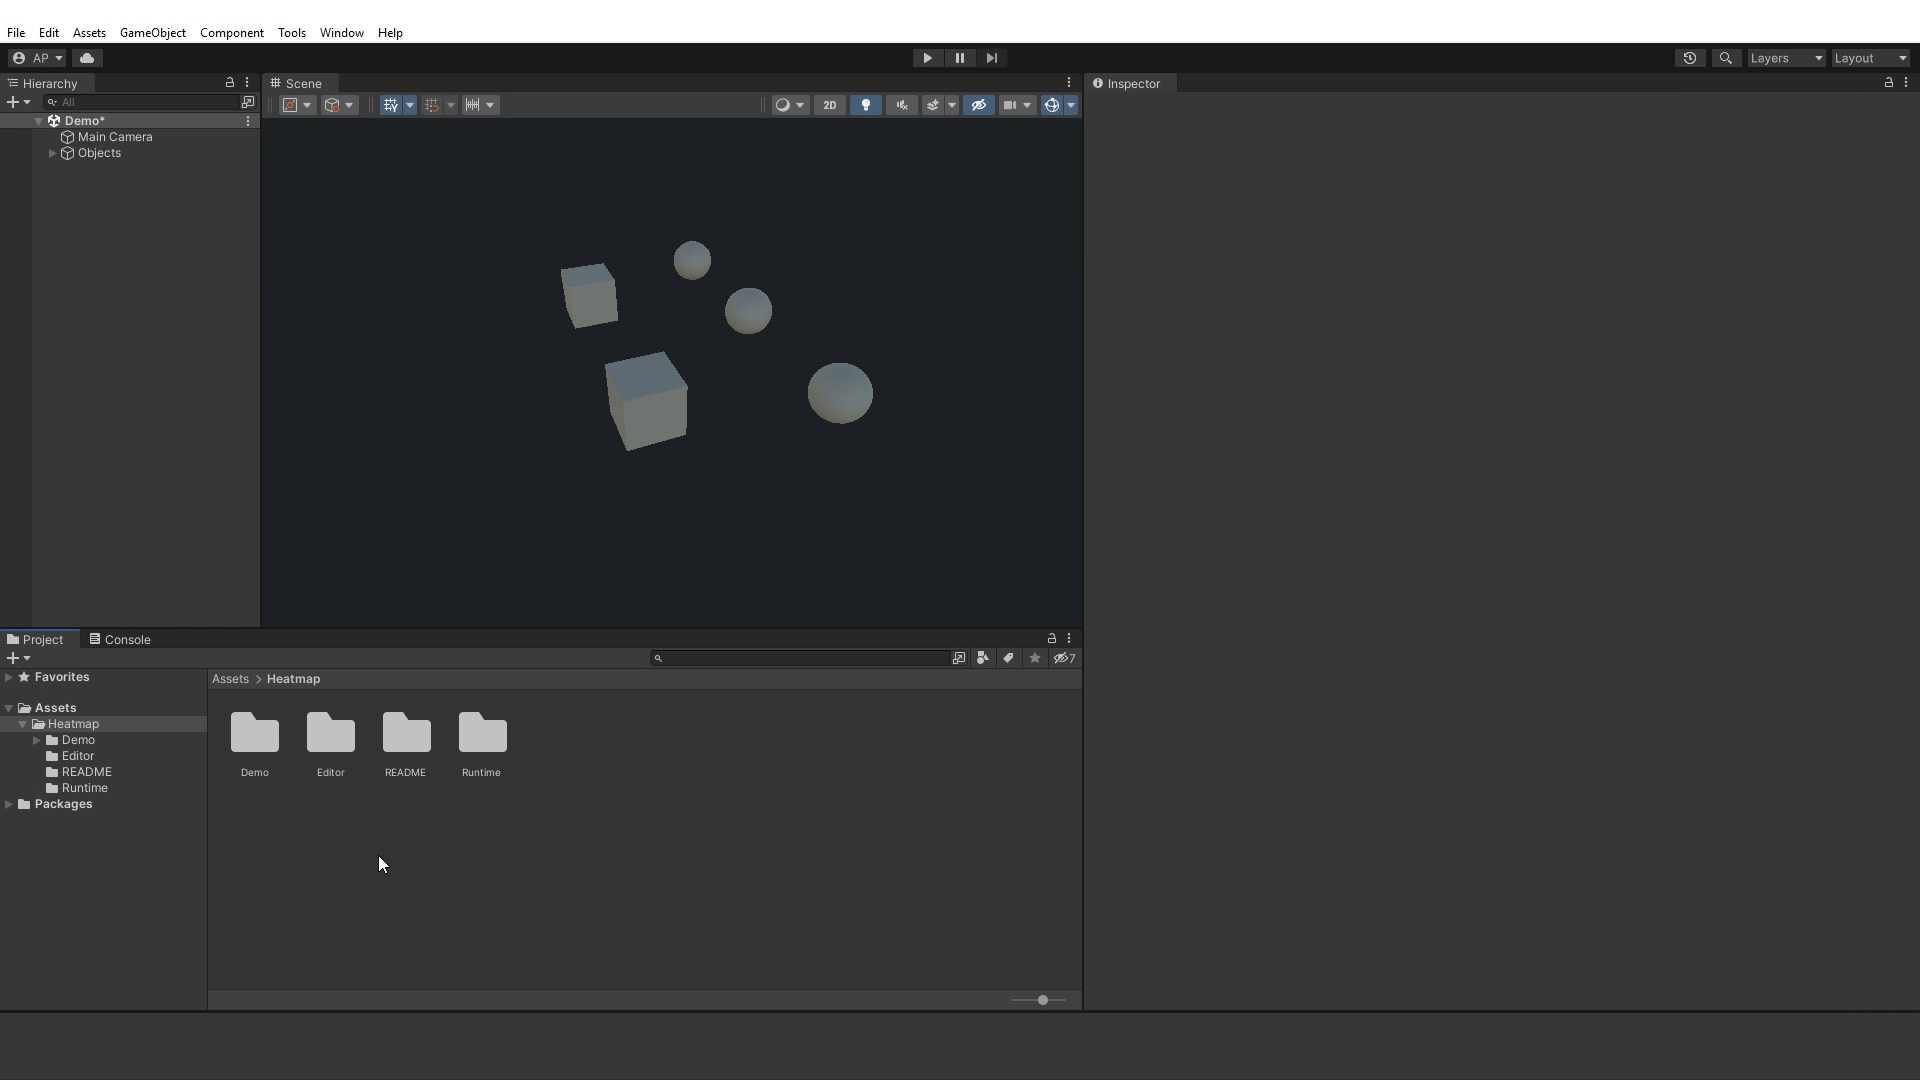
The Scene Performance Analyzer is an editor-only tool that visualizes the performance impact of every renderer in your scene. It estimates the GPU and CPU cost of objects using metrics such as triangle count, material complexity, and renderer state. This information is displayed in the form of a heatmap, helping you identify performance hotspots.
Key Features:
- Instantly see which GameObjects are expensive to render using an in-editor color gradient overlay - Live Heatmap Visualization
- Attributes real per-frame CPU/GPU time across renderers by measured complexity (triangles, submeshes, transparency, shadows, skinning) for a heatmap, with a per-object Measure button for verified ground-truth cost - Accurate Cost Estimation
- Adjust thresholds, colors, update frequency, and visibility settings through a dedicated window - Customizable Settings
- Editor-only script that does not affect runtime builds or gameplay logic - Lightweight and Safe
- Ground-truth Isolation Measurement - one-click "Measure" per object: samples real frame time with and without the renderer, reporting its actual cost, not a heuristic
- Real Frame Timing - CPU and GPU frame time pulled directly from Unity's ProfilerRecorder and FrameTimingManager, with a "GPU: n/a" fallback on platforms that don't expose GPU timing
Ideal For:
- Developers working with large, open-world scenes
- Artists optimizing static or baked environments
- VR and mobile game developers with strict performance budgets
- Teams aiming to catch render bottlenecks before profiling
Very Easy Setup
Simply install the package, add the ScenePerformanceAnalyzer script, and open the Scene Performance Analyzer window. The system starts tracking renderers and generating the heatmap on start.
From the publisher's Asset Store listing.
Technical details
Supported Render Pipelines
- Built-in Render Pipeline (BRP)
- Universal Render Pipeline (URP)
- (Tested in 2021 LTS and newer. Heatmap appearance may vary slightly depending on RP shader support.) High Definition Render Pipeline (HDRP)
System Requirements
- 2021.3 LTS or newer recommended
- Editor-only: does not affect builds
- Compatible with Windows, macOS, and Linux editors
How It Works
- Samples real per-frame CPU/GPU timing via Unity's Profiler and FrameTimingManager APIs
- Distributes that measured frame time across visible renderers, weighted by triangle count, submesh/material count, transparency (render queue), shadows, and skinning
- Optional per-object "Measure" isolates a renderer (disable -> re-sample -> restore) for an accurate cost reading, independent of the heatmap's attributed estimate
- Heatmap color is calculated per object using weighted scoring
Customization Options
- Toggle heatmap visibility in Edit and Play mode
- Adjustable thresholds for low/medium/high impact
- Color settings for each heat level
- Update rate control (live updates or on-demand)
- Object filters (e.g. hide low-impact objects)
- In-scene ms labels above objects, with a red wire outline on the current worst offender
- CSV export includes triangles, vertices, materials, transparency, skinned state, and measured cost
Editor Integration
- Window > Tools > Performance Analyzer
- Preferences integrated for toggling Edit Mode visibility
Performance Impact
- Very low editor overhead, updates in the background at controlled intervals
- Designed to scale with large scenes
Limitations
- The live heatmap's GPU/CPU columns are still attributed estimates, distributed across renderers by measured complexity; they won't perfectly match Unity's Profiler or Frame Debugger.
- For ground-truth per-object cost, use the Measure button: it isolates the renderer and reports its real measured frame-time impact, independent of the heatmap estimate.
Compatibility
| Unity version | Built-in | URP | HDRP |
|---|---|---|---|
| 6000.3.14f1 | Compatible | Compatible | Compatible |
HDRP known issue (Editor-only): When the heatmap overlay is enabled, part of the Scene View toolbar/overlay may appear tinted by the heatmap color. This is visual-only; analyzer features and runtime builds are unaffected. Scope: HDRP Scene View (not URP/Built-in). Workaround: disable “Show Heatmap in Edit Mode”. Fix in progress.
As listed on the Asset Store.